Data collection
How data collection works
Every node can have many data collection items configured (see
Data Collection for detailed description). NetXMS server has a
set of threads dedicated to data collection, called Data Collectors, used to
gather information from the nodes according to DCI configuration. You
can control how many data collectors will run simultaneously, by changing server
configuration parameter ThreadPool.DataCollector.MaxSize.
Node capabilities provide information about available sources for data collection in the Overview-> Capabilities section. The last values of DCIs for the node can be found on the Data Collection tab. Additionally, specific DCIs can be displayed in the Overview` -> Last Values section or as a graph on the Performance tab. More details about DCI display configuration options can be found in the Other options and Performance View chapters.
All configured DCIs are checked for polling requirement every second. If DCI needs to be polled, appropriate polling request is placed into internal data polling queue. First available data collector will pick up the request and gather information from the node according to DCI configuration. If a new value was received successfully, it’s being stored in the database, and thresholds are checked. After threshold checking, data collector is ready for processing new request. If DCI is unsuported it will be polled only every tenth poll, this is not configurable. Processing of a newly received metric value is outlined on the figure below.
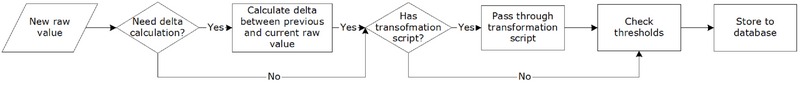
Newly received metric processing
It is also possibility to push data to server. If DCI source is set to Push, server just waits for new values instead of polling from a data source.
By default, DCI data is not collected for the duration while connection between server and agent is broken as poll request would not get to agent. There is special configuration that allows data collection and storage on agent till connection with server is restored and collected data is pushed to the server thereafter. This option is available for metrics, table metrics and proxy SNMP metrics as well as implemented for proxy SNMP table metrics and DCIs with custom schedule. In case of this setup, agent stores DCI configuration locally and does all metric collection and dispatch on its own. DCI configuration is synchronized on connect, DCI configuration change or SNMP proxy server change. Information about configuration options can be found here: Agent caching mode.
DCI configuration
Data collection for a node can be configured using management client. To open data collection tab view, click on node object in Infrastructure or Network perspective, and click Data Collection tab. You will see the list of configured data collection items. From here, since DCI configuration and Last values are combined, one can see collected data and configure new or change existing metrics for monitoring. Right click on an item and all possible configuration options will be available.
Each DCI have multiple attributes which affects the way data is collected. Detailed information about each attribute is given below and can be accessed by selecting Edit…, New parameter… or New table….
General
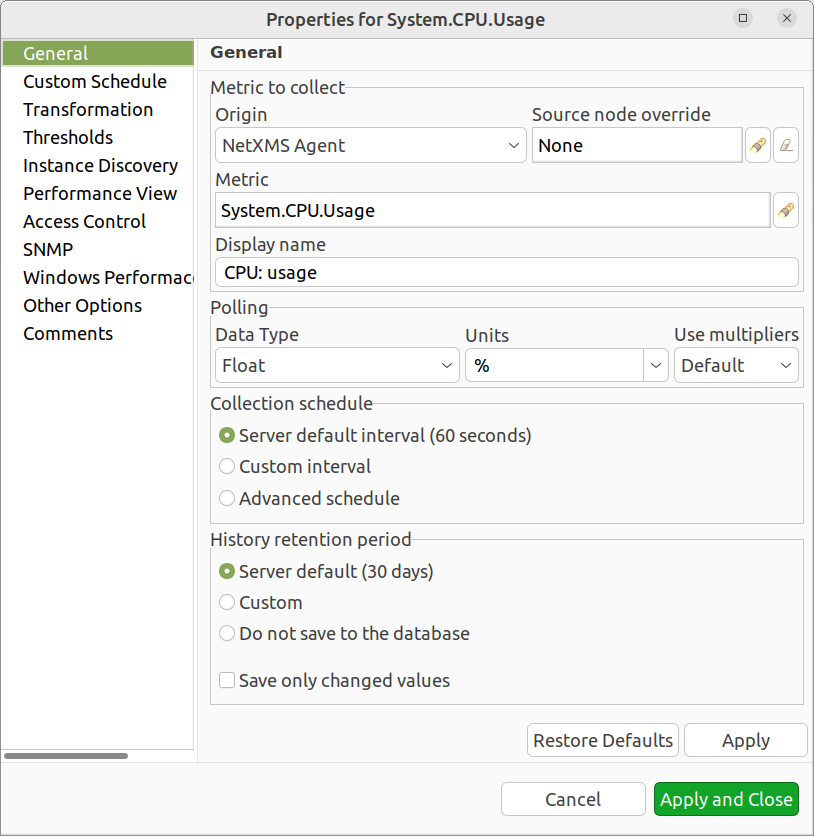
DCI configuration general property page
Display name
Display name is a free form text string describing DCI. It is not used by the server and is intended for better information understanding by operators. If you use the Select button to choose a metric from the list, description field will be filled in automatically.
Metric
Name of the metric of interest, used for making a request to target node. For NetXMS Agent and Internal metrics it will be metric name, and for SNMP agent it will be an SNMP OID. You can use the Select button for easier selection of required metric name.
Available agent metric names are obtained during Configuration poll.
Origin
Origin of data (method of obtaining data). Possible single-value origins are:
Source |
Description |
|---|---|
Internal |
Data generated inside NetXMS server process (server statistics, etc.) |
NetXMS Agent |
Data is collected from NetXMS agent, which should be installed on target node. |
SNMP |
Data is collected via SNMP transport. |
Web service |
Data is obtained from JSON, XML, or plain text retrieved via HTTP/HTTPS |
Push |
Values are pushed by external system (using nxpush, nxapush tools or API), from NXSL script or log file parser. |
Windows Performance counters |
Data is collected via NetXMS agent running on Windows machine.
Windows Performance counters metric has format
|
SM-CLP |
Data is collected via Server Management Command Line Protocol. |
Script |
Value is generated by NXSL script stored in Script Library. Script name and other options are set in Metric field:
|
SSH |
Data is obtained from output of ssh command executed through SSH connection. |
MQTT |
Data is obtained by subcribing to MQTT broker topics. |
Network Device Driver |
Some SNMP drivers (e.g. NET-SNMP, RITTAL) provide metrics for data collection. E.g. NET-SNMP provides information about storage this way. |
Modbus |
Data is collected via Modbus-TCP industrial protocol. See Modbus for more information. |
Ethernet/TP |
Data is collected via Ethernet/TP industrial protocol. |
Push Agent origin is different from all others, because it represents DCIs whose values are pushed to server by external program (usually via nxapush or nxpush command line tool) instead of being polled by the server based on the schedule. Values can also be pushed from a NXSL script launched on the server.
Possible table metric origins are Internal, NetXMS agent, SNMP, Script. Please refer to description in above table.
Data Type
Data type for column. Can be one of the following: Integer,
Unsigned Integer, Integer 64-bit, Unsigned
Integer 64-bit, Counter 32-bit, Counter 64-bit,
Float (floating point number), or String. Selected data
type affects collected data processing - for example, you cannot use operations
like less than or greater than on strings. If you select metric from the
list using the Select button, correct data type will be set
automatically.
Units
For user convenience collected DCI values can have the following predefined units assigned, but it is possible to enter any unit one requires. Most of the units are just displayed after the value, but some of them are special and affect how collected data is displayed:
Unit |
Description |
|---|---|
% |
Percent - symbol used to indicate a percentage, a number or ratio as a fraction of 100. For more details please check Wikipedia |
°C |
Degree in Celsius, unit of temperature. For more details please check Wikipedia |
°F |
Degree in Fahrenheit, unit of temperature. For more details please check Wikipedia |
A |
Ampere, unit of electric current. For more details please check Wikipedia |
B (IEC) |
Bytes in IEC format. Please note that “(IEC)” part will be removed when value is displayed. For more details on difference between IEC and SI please check Wikipedia |
b (IEC) |
Bits in IEC format. Please note that “(IEC)” part will be removed when value is displayed. |
B (Metric) |
Bytes in SI format. Please note that “(Metric)” part will be removed when value is displayed. |
b (Metric) |
Bits in SI format. Please note that “(Metric)” part will be removed when value is displayed. |
B/s |
Bytes per second. For more details please check Wikipedia |
b/s |
Bits per second. For more details please check Wikipedia |
dBm |
Unit of power level expressed using a logarithmic decibel. For more details please check Wikipedia |
Epoch time |
Unix time, measures time by the number of non-leap seconds that have elapsed since 00:00:00 UTC on 1 January 1970. Converts collected into human readable timestamp. For more details please check Wikipedia |
Hz |
Hertz, the unit of frequency. For more details please check Wikipedia |
J |
Joule, unit of energy. For more details please check Wikipedia |
lm |
Lumen, a measure of the perceived power of visible light emitted by a source. For more details please check Wikipedia |
lx |
Lux, unit of illuminance or luminous flux per unit area. For more details please check Wikipedia |
N |
Newton, unit of force. For more details please check Wikipedia |
Pa |
Pascal, unit of pressure. For more details please check Wikipedia |
rpm |
Revolutions per minute. For more details please check Wikipedia |
s |
Second, unit of time. For more details please check Wikipedia |
T |
Tesla, unit of magnetic flux density. For more details please check Wikipedia |
Uptime |
Measure of system reliability. Converts number of seconds since uptime into human readable format. For more details please check Wikipedia |
W |
Watt, unit of power or radiant flux. For more details please check Wikipedia |
V |
Volt, electric potential between two points of a conducting wire. For more details please check Wikipedia |
Ω |
Ohm, unit of electrical resistance. For more details please check Wikipedia |
Use multipliers
This boolean setting gives convenience of displaying some measurements in more readable form. For example, if enabled, 1230000 becomes 1.23 M. Please note - setting has no effect on units “%”, “°C”, “°F”, “dBm” and “rpm”. Everything with (IEC) will use binary multipliers both for calculation and to display value. This setting is taken into consideration only to display value; it is not converting value in the database. Selection here will be taken to format value when macro %<{format-specifier}name> with formatting is used. In Other options property page it is possible to set fixed multiplier degree. Again, it is used for display purposes only, however will be used when macro %<{format-specifier}name> is used.
Source node override
Source node of metrics collection. This can be used when other node provides information about current node. In this way, platform provides additional flexibility of where metrics collection is taking place.
Other example of usage is virtual nodes (nodes with IP 0.0.0.0). In this case, node state can be obtained from the DCI created on current node, but collected from the other one.
Data is collected from the current node if no value is set.
Collection schedule
Polling mode and interval describe schedule type and interval between consecutive polls, in seconds. However, collecting too many values for too long will lead to significant increase of your database size and possible performance degradation.
Following options can be selected:
Server default interval - default value will be taken from DataCollection.DefaultDCIPollingInterval server configuration parameter.
Custom interval - Allows to enter a custom value. This field supports macro resolution, so e.g. you can use %{polling_interval:600} macro that will take value of
polling_intervalcustom attribute or 600, if such custom attribute is not present on the node.Advanced scheduling - schedules configured in Custom Schedule page will be used.
If you turn on Advanced Schedule flag, additional link to Custom Schedule will appear and, once configured, server will use custom schedule for collecting DCI values instead of fixed intervals. Advanced schedule consists of one or more records; each representing desired data collection time in cron-style format.
See Cron format for supported cron format options.
For DCI Collection schedule it’s possible to specify optional sixth (first from left) cron field for resolution in seconds. It’s not recommended to use seconds in custom schedules as your main data collection strategy though. Use seconds only if it is absolutely necessary.
History retention period
This attribute specifies how long the collected data should be kept in database, in days. Minimum retention time is 1 day and maximum has not limit. However, keeping too many collected values for too long may lead to significant increase of your database size and possible performance degradation.
Following options can be selected:
Server default - default value will be taken from DataCollection.DefaultDCIRetentionTime server configuration parameter.
Custom - Allows to enter a custom value. This field supports macro resolution, so for example you can use %{storage_period:30} macro that will take value of
storage_periodcustom attribute or 30 if such custom attribute is not present on the node.Do not save collected data to database - will not save collected data to database, but will store last value in memory
Last option is used when it is required to show latest (every 1 second collected) data on Dashboard, however it would result in excessive data stored in database. So, 2 DCI configurations are created - one to store historical data collected once per minute and the second one, that is not stored in database, but is collected every second and displayed on dashboards in close to real time.
Save only changed values - if enabled, value is saved to the database only if it differs from last saved value.
Cluster
This section is available only for DCI’s collected on cluster.
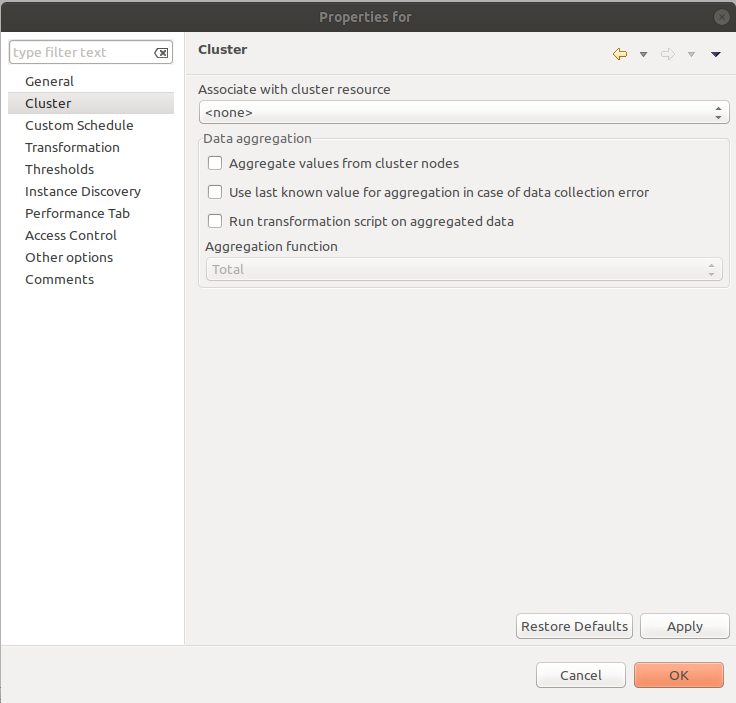
DCI configuration cluster property page
Associate with cluster resource
In this field one can specify cluster resource associated with DCI. Data collection and processing will occur only if node, you configured DCI for, is current owner of this resource. This field is valid only for cluster member nodes.
Data aggregation
This section specifies how cluster data aggregation is done. Aggregate values from cluster nodes option means that DCI from cluster will be collected on each node separately and aggregated on cluster using one of the aggregation options.
Aggregation options:
Total
Average
Min
Max
Data Transformations
In simplest case, NetXMS server collects values of specified metrics and stores them in database. However, you can also specify various transformations for original value. For example, you may be interested in a delta value, not in a raw value of some metric. Or, you may want to have metric’s value converted from bytes to kilobytes. All transformations will take place after receiving new value and before threshold processing.
Data type after transformation - drop down menu of required data type.
Data transformation consists of two steps. In the first step, delta calculation is performed. You can choose four types of delta calculation:
Function |
Description |
|---|---|
None |
No delta calculation performed. This is the default setting for newly created DCI. |
Simple |
Resulting value will be calculated as a difference between current raw value and previous raw value. By raw value it is meant the metric’s value originally received from host. |
Average per second |
Resulting value will be calculated as a difference between current raw value and previous raw value, divided by number of seconds passed between current and previous polls. |
Average per minute |
Resulting value will be calculated as a difference between current raw value and previous raw value, divided by number of minutes passed between current and previous polls. |
In second step, custom transformation script is executed (if present). By
default, newly created DCI does not have a transformation script. If
transformation script is applied, the resulting value of the first step is
passed to the transformation script as a parameter; and a result of script
execution is the final DCI value. Transformation script gets original value as
first argument (available via special variable $1), and also has two
predefined global variables: $node (reference to current node object), and
$dci (reference to current DCI object).
In case of table DCIs, $1 special variable is an object of type Table.
For more information about NetXMS scripting language, please refer to Scripting chapter in this manual.
Transformation script can be tested in the same view, by clicking Test… and entering test input data.
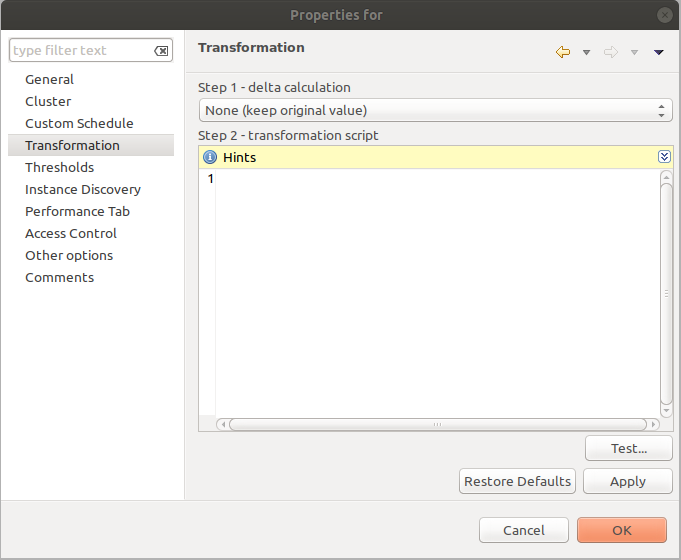
DCI configuration transformation property page
Thresholds
For every DCI you can define one or more thresholds. For each threshold there is a pair of condition and event - if condition becomes true, associated event is generated. To configure thresholds, open data collection Edit… mode for node or template DCI. You can add, modify and delete thresholds using buttons below the threshold list. If you need to change the threshold order, select one threshold and use arrow buttons located on the right to move the selected threshold up or down.
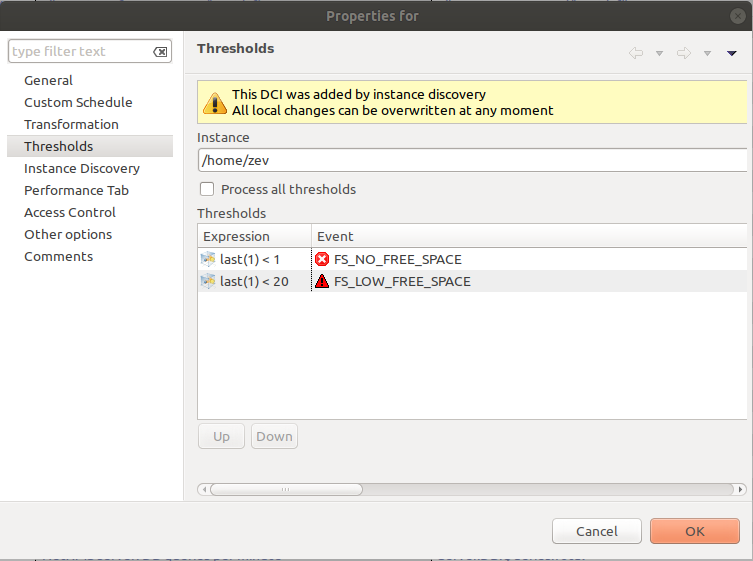
DCI configuration threshold property page
Threshold Processing
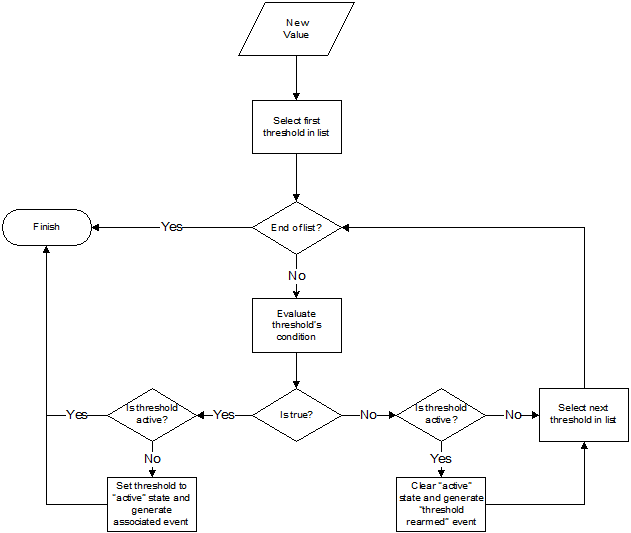
Threshold processing algorithm
As you can see from above flowchart, threshold order is very important. Let’s
consider the following example: you have DCI representing CPU utilization on
the node, and you wish two different events to be generated - one when CPU
utilization exceeds 50%, and another one when it exceeds 90%. What happens when
you place threshold > 50 first, and > 90 second? The following table
shows values received from host and actions taken by monitoring system
(assuming that all thresholds initially unarmed):
Value |
Action |
|---|---|
10 |
Nothing will happen. |
55 |
When checking first threshold ( |
70 |
When checking first threshold ( |
95 |
When checking first threshold ( |
Please note that second threshold actually is not working, because it is
masked by the first threshold. To achieve desired results, you should place
threshold > 90 first, and threshold > 50 second.
You can disable threshold ordering by checking Always process all thresholds checkbox. If enabled, system will always process all thresholds.
Threshold Configuration
When adding or modifying a threshold, you will see the following dialog:
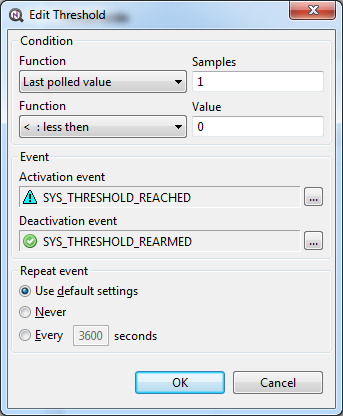
Threshold configuration dialog
First, you have to select what value will be checked:
Last polled value |
The last value will be used. If number of polls is set to more then
|
Average value |
Average value for last |
Mean deviation |
Mean absolute deviation for last |
Diff with previous value |
Delta between the last and previous values will be used. If DCI data type
is string and the last and previous values match, system will use value
of |
Data collection error |
An indicator of data collection error. Instead of DCI’s value, system
will use |
Sum of values |
Sum DCI values for the number of samples specified and will compare it with the value. Side note - in THRESHOLD_REACHED there are two parameters - one is last DCI value and the other is value calculated by the threshold, and if number of samples is >1, then these values can be different. |
Script |
This will enable script editor, so one can make a script that makes a decision. If it returns true it means to trigger the threshold, if false - rearm threshold. There are some variables available inside the script, $dci, $1 etc. Value input field (which is below Samples) can be read from there, which can be convenient, as one can still use this field to store some threshold value. |
Absolute deviation |
Similar to mean deviation - will take number of datapoints specified in Samples and calculate deviation from these. |
Anomaly |
If checkbox “Detect anomalies” is selected, server will use Isolation Forest algorithm to check if new value is an outlier within two set of data points - all values within 30 minutes of current time of the day for last 30 days, and all values within 30 minutes around current time of the day on the same day of the week for last 10 weeks. If new data point is classified as outlier in both data sets, DCI will be marked as having anomalous value. Using this setting may adversely affect your database performance. This is an experimental feature - use with caution. |
Second, you have to select comparison function. Please note that not all functions can be used for all data types. Below is a compatibility table:
Type/Function |
Integer |
Unsigned Integer |
Counter 32-bit |
Integer 64-bit |
Unsigned Integer 64-bit |
Counter 64-bit |
Float |
String |
|---|---|---|---|---|---|---|---|---|
Less |
X |
X |
X |
X |
X |
X |
X |
|
Less or equal |
X |
X |
X |
X |
X |
X |
X |
|
Equal |
X |
X |
X |
X |
X |
X |
X |
X |
Greater or equal |
X |
X |
X |
X |
X |
X |
X |
|
Greater |
X |
X |
X |
X |
X |
X |
X |
|
Not equal |
X |
X |
X |
X |
X |
X |
X |
X |
Like |
X |
|||||||
Not like |
X |
|||||||
Like (ignore case) |
X |
|||||||
Not like (ignore case) |
X |
Third, you have to set a value to check against. If you use like or not
like functions, value is a pattern string where you can use meta characters -
asterisk (*), which means “any number of any characters”, and/or question mark
(?), which means “any character”.
If you use numeric threshold value, the following multipliers are supported:
K, M, G, T, Ki, Mi, Gi, Ti. So, e.g. instead of
value “1000000000” you can put “1G” into the Value field.
Fourth, you have to select events to be generated when the condition becomes
true or returns to false. By default, system uses SYS_THRESHOLD_REACHED and
SYS_THRESHOLD_REARMED events, but in most cases you will change it to your
custom events.
You can also configure threshold to resend activation event if threshold’s condition remain true for specific period of time. You have three options - default, which will use server-wide settings, never, which will disable resending of events, or specify interval in seconds between repeated events.
Thresholds and Events
You can choose any event to be generated when threshold becomes active or
returns to inactive state. However, you should avoid using predefined system
events (their names usually start with SYS_ or SNMP_). For example, you
may set event SYS_NODE_CRITICAL to be generated when CPU utilization exceeds
80%. System will generate this event, but it will also generate the same event
when node status will change to CRITICAL. In your event
processing configuration, you will be unable to determine actual reason for
that event generation, and probably will get some unexpected results. If you
need custom processing for specific threshold, you should create your own event
first, and use this event in the threshold configuration. NetXMS has some
preconfigured events that are intended to be used with thresholds. Such event names
start with DC_.
System will pass the following parameters to events generated as a reaction to single-value DCI threshold violation:
Parameter number |
Named parameter |
Description |
|---|---|---|
1 |
dciName |
Data collection item name |
2 |
dciDescription |
Data collection item description |
3 |
thresholdValue |
Threshold value |
4 |
currentValue |
Current value (e.g. average for several samples for averaging threshold) that is compared to threshold value |
5 |
dciId |
Data collection item ID |
6 |
instance |
Instance |
7 |
isRepeatedEvent |
Repeat flag |
8 |
dciValue |
Last collected DCI value |
9 |
operation |
Threshold’s operation code |
10 |
function |
Threshold’s function code |
11 |
pollCount |
Threshold’s required poll count |
12 |
thresholdDefinition |
Threshold’s textual definition |
Event parameters can be accessed by number or by name via macros to form event message. For example, if you are creating a custom event that is intended to be generated when file system is low on free space, and wish to include file system name, actual free space, and threshold’s value into event’s message text, you can use message template like this:
File system %<instance> has only %<currentValue> bytes of free space
(threshold: %<thresholdValue> bytes)
For table threshold violation the following parameters are passed to generated events:
Parameter number |
Named parameter |
Description |
|---|---|---|
1 |
dciName |
Table DCI name |
2 |
dciDescription |
Table DCI description |
3 |
dciId |
Table DCI ID |
4 |
row |
Table row |
5 |
instance |
Instance |
For events generated on threshold’s return to inactive state (default event is
SYS_THRESHOLD_REARMED), event parameter list is different:
Parameter number |
Named parameter |
Description |
|---|---|---|
1 |
dciName |
Data collection item name |
2 |
dciDescription |
Data collection item description |
3 |
dciId |
Data collection item ID |
4 |
instance |
Instance |
5 |
thresholdValue |
Threshold value |
6 |
currentValue |
Current value (e.g. average for several samples for averaging threshold) that is compared to threshold value |
7 |
dciValue |
Last collected DCI value |
8 |
operation |
Threshold’s operation code |
9 |
function |
Threshold’s function code |
10 |
pollCount |
Threshold’s required poll count |
11 |
thresholdDefinition |
Threshold’s textual definition |
For table DCI threshold rearm the following parameters are passed to generated events:
Parameter number |
Named parameter |
Description |
|---|---|---|
1 |
dciName |
Table DCI name |
2 |
dciDescription |
Table DCI description |
3 |
dciId |
Table DCI ID |
4 |
row |
Table row |
5 |
instance |
Instance |
Instance
Each DCI has an Instance attribute, which is a free-form text string, passed as a 6th parameter to events associated with thresholds. You can use this parameter to distinguish between similar events related to different instances of the same entity. For example, if you have an event generated when file system was low on free space, you can set the Instance attribute to file system mount point.
Sometimes you may need to monitor multiple instances of some entity, with exact names and number of instances not known or different from node to node. Typical example is file systems or network interfaces. To automate creation of DCIs for each instance, you can use instance discovery mechanism. First you have to create “master” DCI. Create DCI as usual, but in places where normally you would put instance name, use the special macro {instance}. Then, go to Instance Discovery tab in DCI properties, and configure instance discovery method and optionally filter script.
Instance discovery creates 2 macros for substitution:
{instance} - instance name
{instance-name} - instance user-readable description
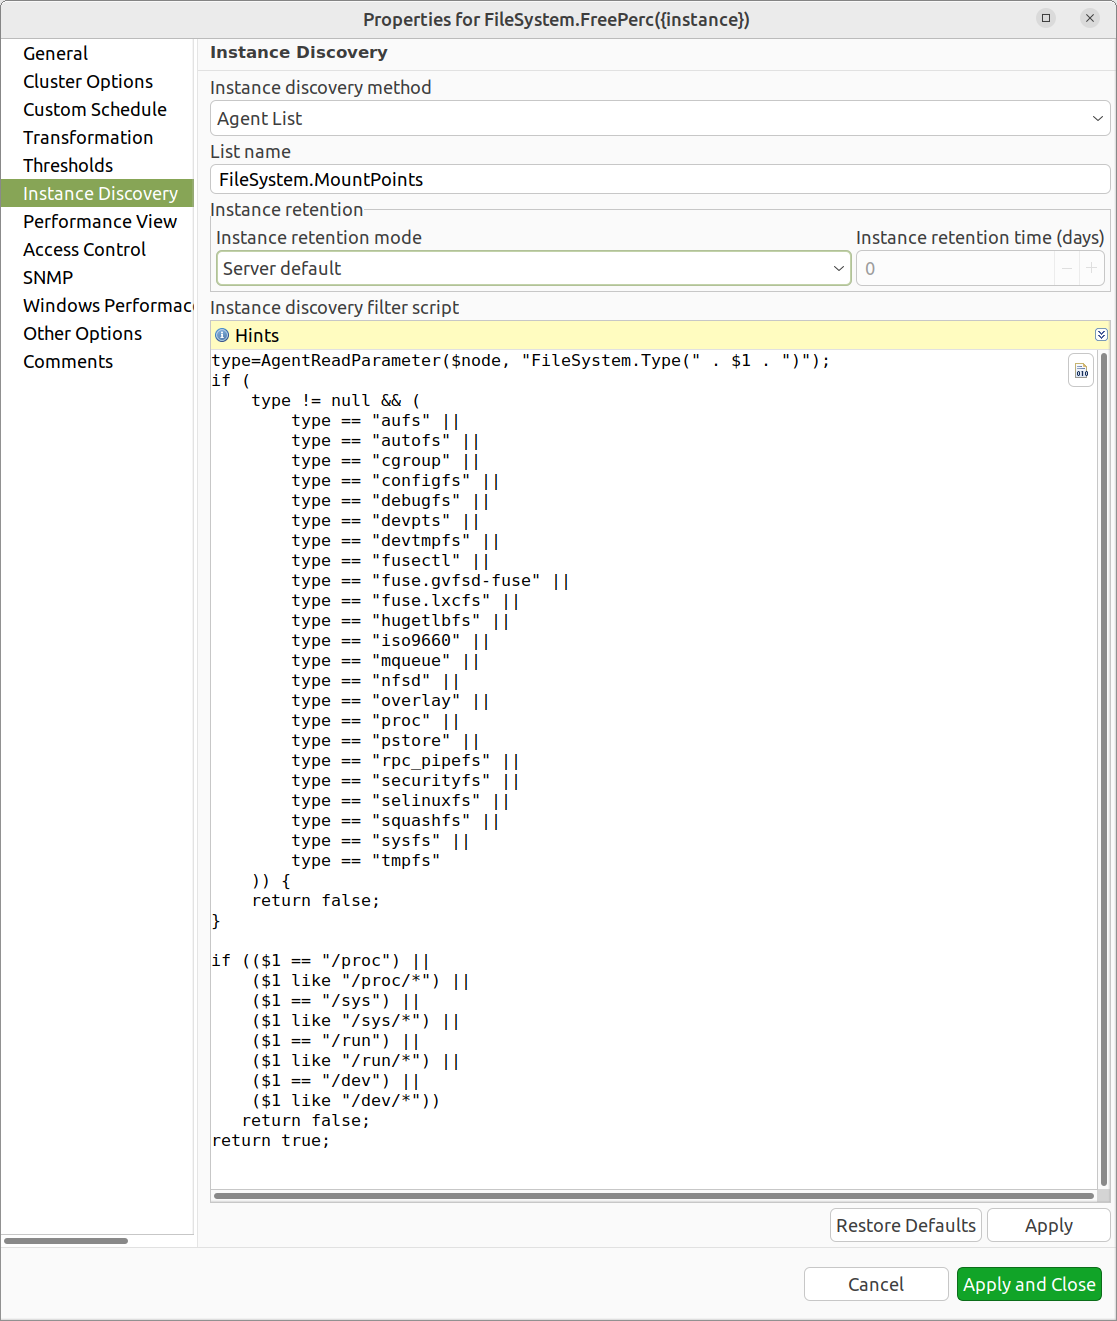
DCI configuration instance discovery property page
Instance Discovery Methods
The following instance discovery methods are available:
Method |
Input Data |
Description |
|---|---|---|
Agent List |
List name |
Read list from agent and use it’s values as instance names. |
Agent Table |
Table name |
Read table from agent and use it’s instance column values as instance
names. If there are several instance columns in that table, a
concatenation of values will be used, separated by |
SNMP Walk - Values |
Base OID |
Do SNMP walk starting from given OID and use values of returned varbinds as instance names. |
SNMP Walk - OIDs |
Base OID |
Do SNMP walk starting from given OID and use IDs of returned varbinds as instance names. |
Script |
Script name |
Instance names are provided by a script from script library. The script should return an array (with elements representing instance names) or a map (keys represent instance names and values represent user-readable description) |
Windows Performance Counters |
Object name, e.g. |
Instances of given object will be taken. |
Web Service |
Definition:path |
Web service request field contains web service definition name with optional arguments and path to the root element of the document where enumeration will start. Each sub-element of given root element will be considered separate instance. |
Internal Table |
Table name |
Read NetXMS server internal table and use it’s instance column
values as instance names. If there are several instance columns in that
table, a concatenation of values will be used, separated by |
Push Data |
Regular expression |
Instances are created automatically when push data arrives with a DCI name matching the given regular expression. The first capture group of the regular expression is used as the instance name. Added in version 6.0. |
Instance Discovery Filter Script
You can optionally filter out unneeded instances, transform instance names and add user-readable description using filtering script written in NXSL. Script will be called for each instance and can return either a binary value or an array.
If binary value is returned, it has the following meaning:
TRUE (to accept instance), FALSE (to reject instance).
If an array is returned, then instance is counted as accepted. Only first element of the array is mandatory, the rest elements are optional (but to include an element, all preceding elements should be included). Array structure:
Data type |
Description |
|---|---|
String |
Instance name, that will be available as {instance} macro. |
String |
Instance user-readable description, that will be available as {instance-name} macro |
NetObj |
Object connected with this DCI |
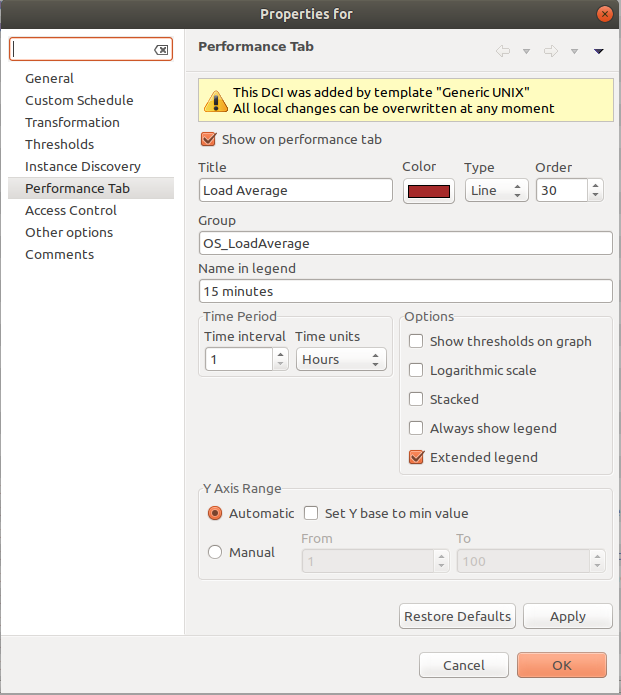
Performance view
This section provides configuration options for displaying DCI values as line charts on the Performance tab. Various options are available to visually represent the collected data; see Data and Network visualization for more details.
Note
Note: Not available for table metrics.
DCI configuration instance discovery property page
Multiple DCIs can be grouped in one graph. To group them use the same group name in “Group” field.
Access Control
This page provides access control management option to each DCI. If no user set, then access rights are inherited from node. So any user that is able to read node is able to see last value of this DCI and user that is able to modify node is able to change and see DCI configuration. When list is not empty, then both access to node and access to DCI are check on DCI configuration or value request.
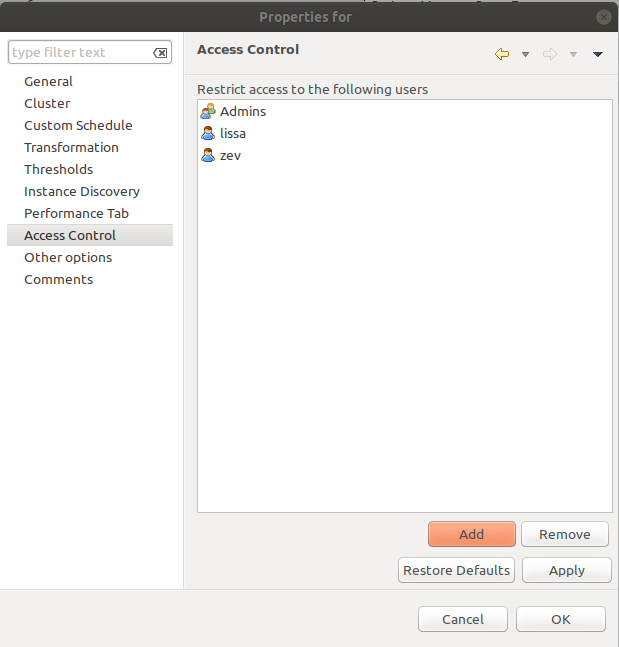
DCI configuration access control property page
SNMP
SNMP page provides additional options for SNMP data collection or processing. Like: how to interpret collected SNMP octet string or to use custom port or version for data collection.
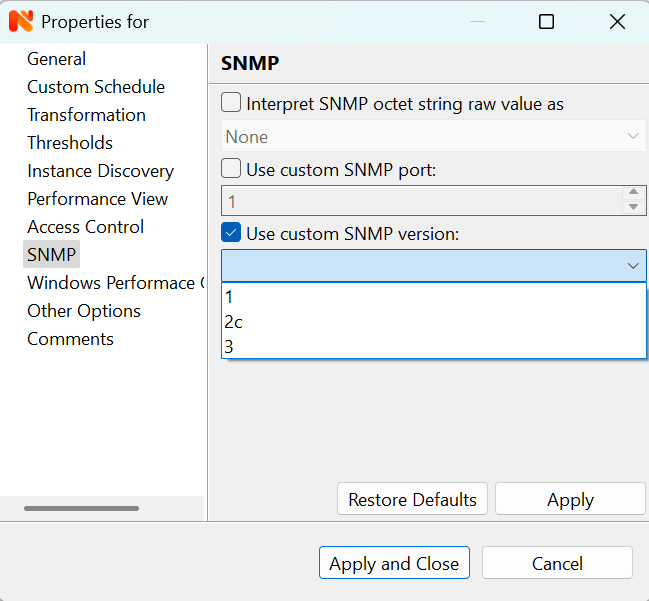
DCI configuration SNMP property page
Windows Performance Counters
This page provides additional options for Windows Performance Counters data collection.
Note
Some Windows performance counters, such as
\Processor Information(_Total)\% Processor Utility, require the
Sample count to be set to 2. This is because certain performance counters
need to be queried twice to calculate a delta value.
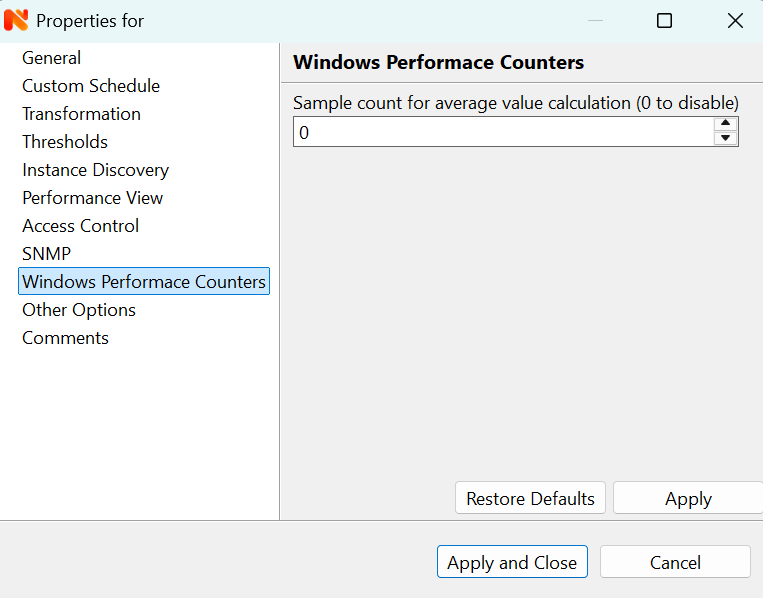
DCI configuration Windows Performance Counters property page
Other options
Other available options:
Show last value in object tooltips and large labels on maps - last value of this DCI is shown in tooltips and large labels on network maps.
Show last value in object overview - last value of this DCI is shown in Last Values section of Overview tab.
Use this DCI for node status calculation - Uses value returned by this DCI as a status, that participate in object status calculation. Such kind of DCI should return integer number from 0 till 4 representing object status.
Hide in view mode - hides DCI from Data Collection tab when it is in view mode. Useful for DCIs that are used only for internal calculations.
Agent cache mode - override node level agent cache mode setting for this DCI.
Multiplier degree - set fixed multiplier degree for this DCI. This setting is used for display purposes only, however will be used when macro %<{format-specifier}name> is used.
Related object - object that is related to collected DCI, e.g. node’s network interface. Related object can be set by instance discovery filter script and accessible in NXSL from DCI object.
Interpretation - allows to specify that DCI collects network traffic value. Used by network maps to display traffic information.
Tag - free-form text string that can be used to tag DCIs. Allows to filter DCIs in Data Collection tab, match DCIs to display on dashboards, find DCIs from NXSL scripts, etc.
Interpret unsupported state as collection error - when enabled, a DCI that enters unsupported state will be treated as a data collection error instead. This is useful when you want threshold-based alerting on collection failures for metrics that would otherwise silently go into unsupported state.
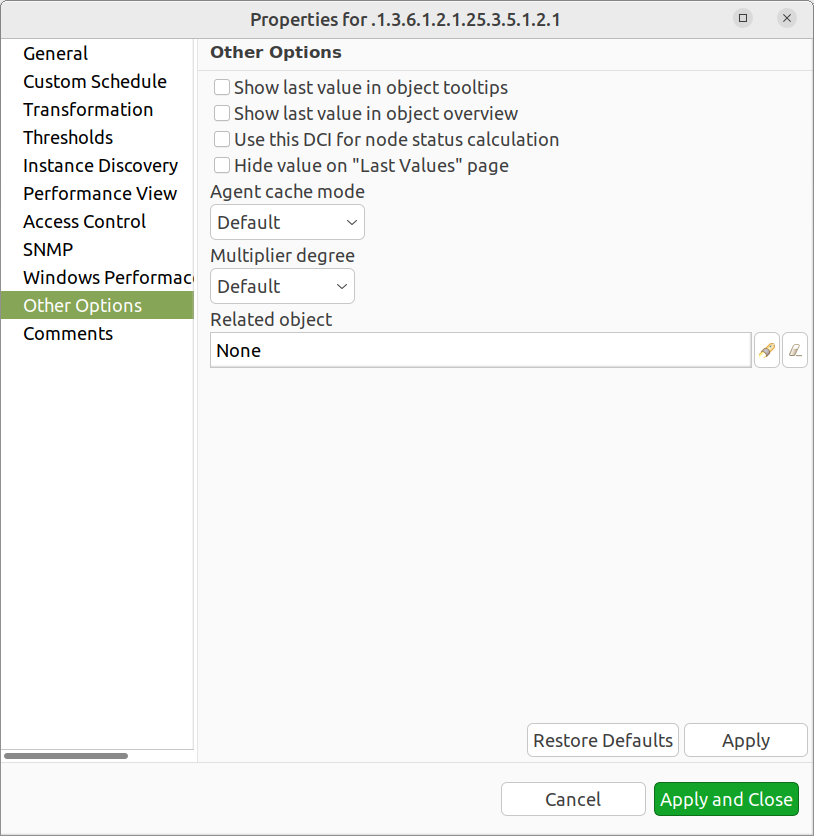
DCI configuration other option property page
Push metrics
NetXMS gives you ability to push DCI values when you need it instead of polling them on specific time intervals. To be able to push data to the server, you should take the following steps:
Set your DCI’s origin to Push Agent and configure other properties as usual, excluding polling interval which is meaningless in case of pushed data.
Create separate user account or pick an existing one and give “Push Data” access right on the DCI owning node to that user.
Use nxapush or nxpush utility or client API for pushing data.
DCI types
Single-value DCIs
Single-value metrics, as the name suggests, collect only one data value.
Table DCIs
Table metrics can collect data in bulk, effectively encapsulating multiple values that can be collected simultaneously.
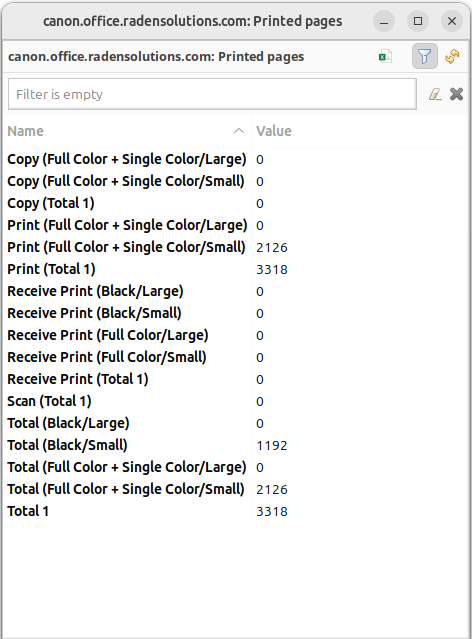
Table example
They’re primarily used when it is necessary to gather bulk data, like data sets that can be acquired together or for atomic collection. Atomic collection is when you need to take a data snapshot that consists of multiple items collected at the exact same time. By right-click on string or non string value one can access history, and line chart builds are possible for non string values.
There are distinct benefits to using table metrics. But they’re not without their disadvantages. As tables are not single values, they require more storage, which can be one of the potential drawbacks.
Furthermore, the threshold configuration can be more complicated for table metrics because they have multiple rows and columns.
Unlike a single value where you can easily specify a threshold for when something is wrong, with a table, you have to specify which instance or item in a column has an issue.
List DCIs
Usually DCIs have scalar values. A list DCI is a special DCI which returns a list of values. List DCIs are mostly used by NetXMS internally (to get the list of network interfaces during the configuration poll, for example), but can also be utilized by user in some occasions. NetXMS Management Client does not support list DCIs directly, but their names are used as input parameters for Instance Discovery methods. List DCI values can be also obtained with nxget command line utility (e.g. for use in scripts).
Agent caching mode
Agent caching mode allows metric data to be obtained for the time being while connection between server and agent have been broken. This option is available for metrics, table metrics and proxy SNMP metrics as well as for proxy SNMP table metrics and DCIs with custom schedule. In absence of connection to the server, collected data is stored on agent and once connection is restored, data is sent to server. Detailed description can be found there: How data collection works.
Agent side cache is configurable globally, on node and DCI levels. Configuration can be changed separately on each level. By default it’s off.
All collected data goes thought all transformations and thresholds only when it comes to server. In order to prevent generation of old events, one can set DataCollection.OfflineDataRelevanceTime configuration variable to time period in seconds within which received offline data still relevant for threshold validation. By default it is set to 1 day.
Configuration
Agent cache mode can be configured:
globally - set configuration parameter Agent.DefaultCacheMode to on or off in Configuration perspective -> Server configuration.
on node level - Agent cache mode can be changed to on, off or default (use global settings). Right click on a node in Infrastructure perspective and select Properties followed by Polling page.
on DCI level - Agent cache mode can be changed to on, off or default (use node level settings) in DCI properties on Other Options page.
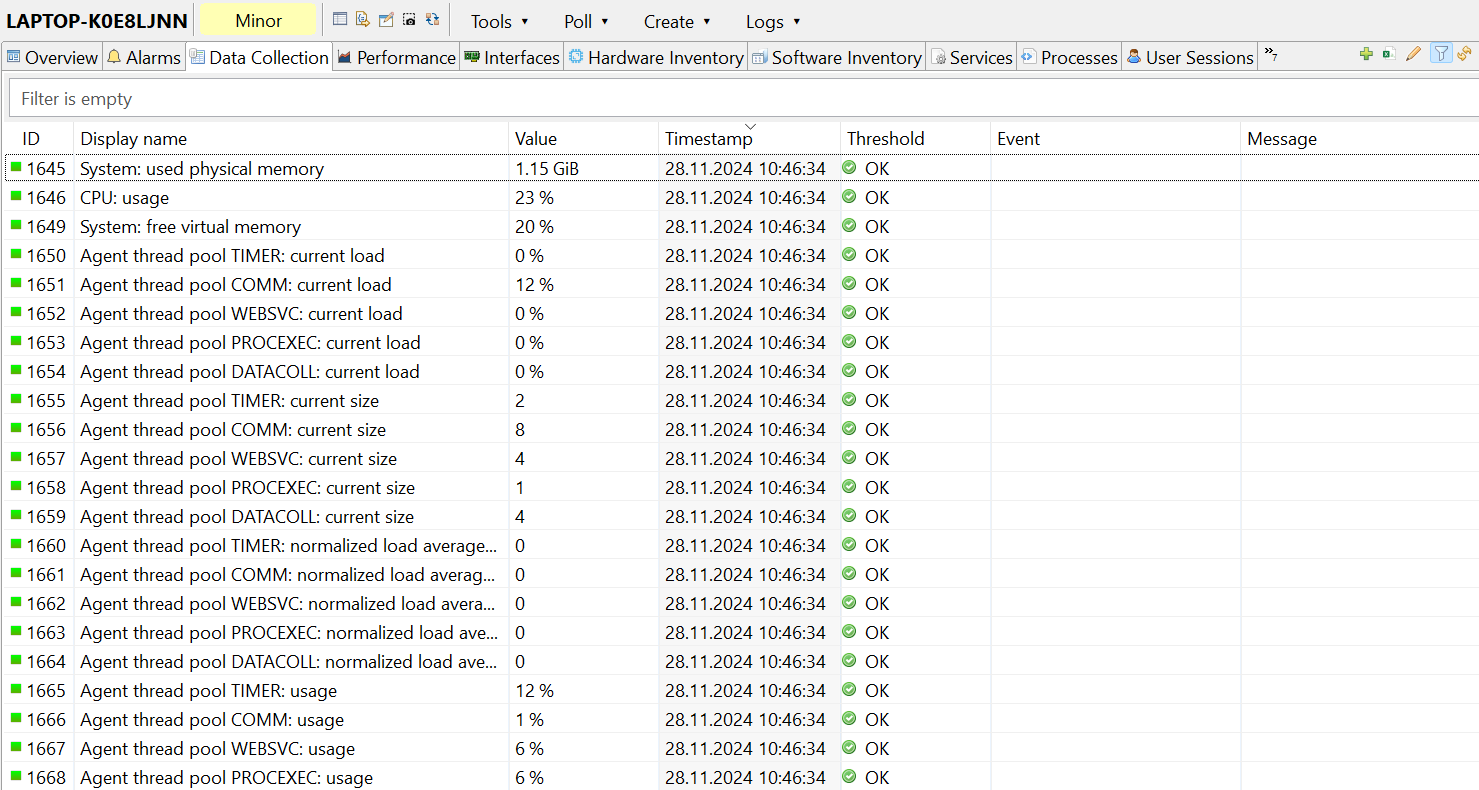
Data Collection tab
Data Collection tab allows to view collected data and change configuration of DCIs. There are two modes - view and edit. In view mode the following information is displayed for each DCI: ID, display name, last value, last collection timestamp and threshold status.
Note
In view mode, instance discovery prototypes are not displayed. Additionally, disabled or unsupported DCIs may not be visible by default. Settings in the context menu control whether these DCIs are displayed.
Double-clicking a a DCI in view mode opens line chart for this DCI. Other types of charts and history of values is available from context menu of a DCI.
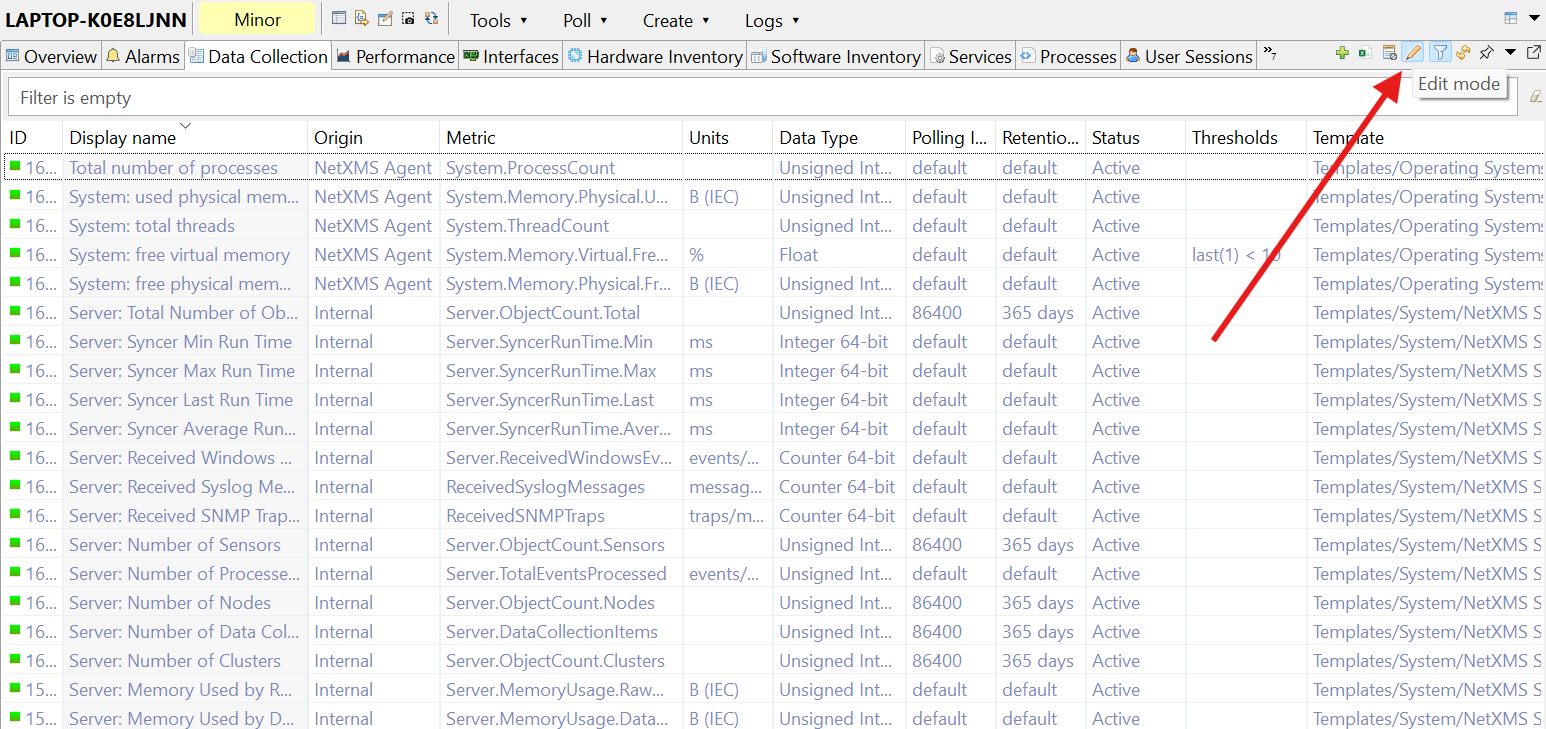
Click on Edit mode to switch to edit mode. In this mode all DCIs configured on a node are displayed with detailed information including: ID, display name, origin, metric, units, data type, polling interval, retention time, tag, status, configured thresholds, template name, related object name.
DCI table creation example
Encapsulating earlier covered configuration options - in Data Collection tab view one can, for example, create DCI table with Agent cache mode enabled in the following way:
Create new table by right click in Data Collection tab view followed by selecting .
Select Origin on General page as NetXMS Agent (default option) and table metrics from pop-up view when clicking on selector.
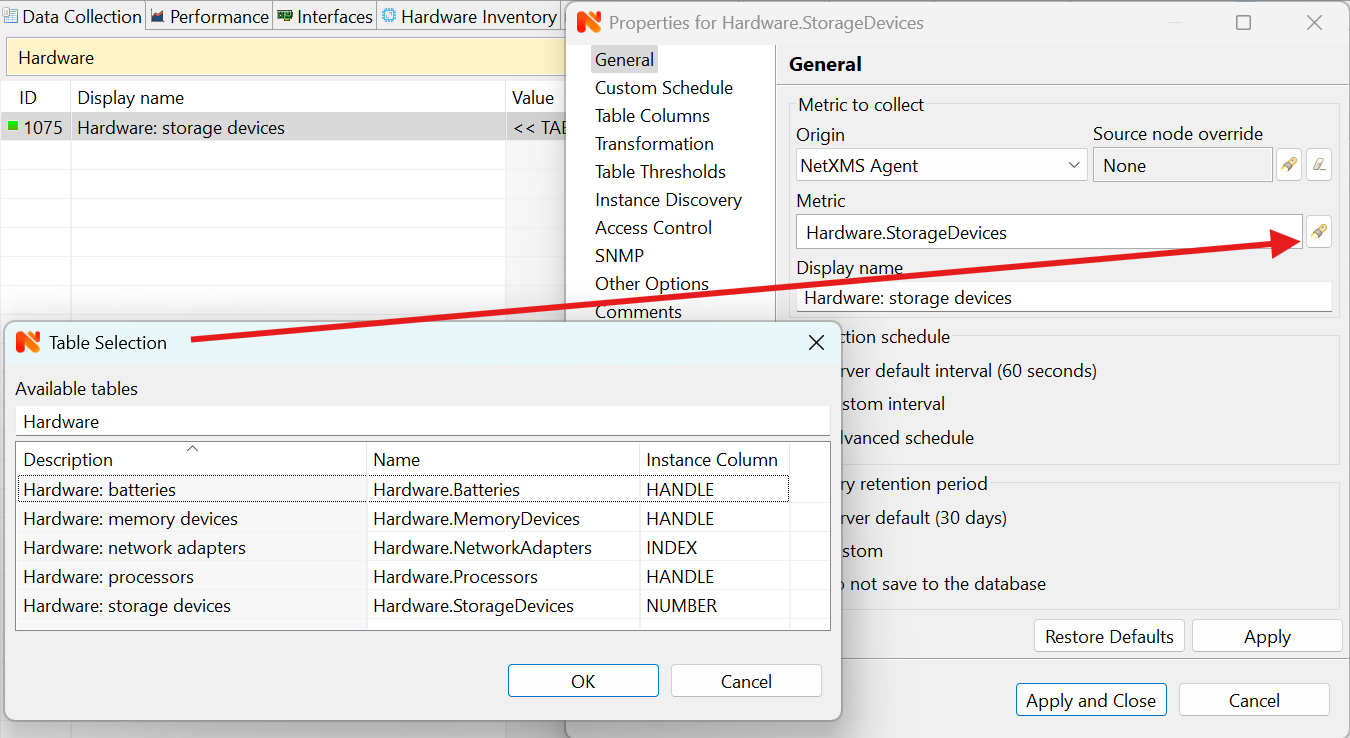
Note
Pop up view from Metric selector may be different for other sources in Origin.
Currently supported DCI table sources are:
Internal
NetXMS Agent
SNMP
Script
Currently supported DCI table sources with agent cache enabled:
NetXMS Agent
SNMP
Currently supported DCI table sources with agent cache and proxy enabled:
NetXMS Agent
SNMP
Configure agent caching mode as per instructions above.
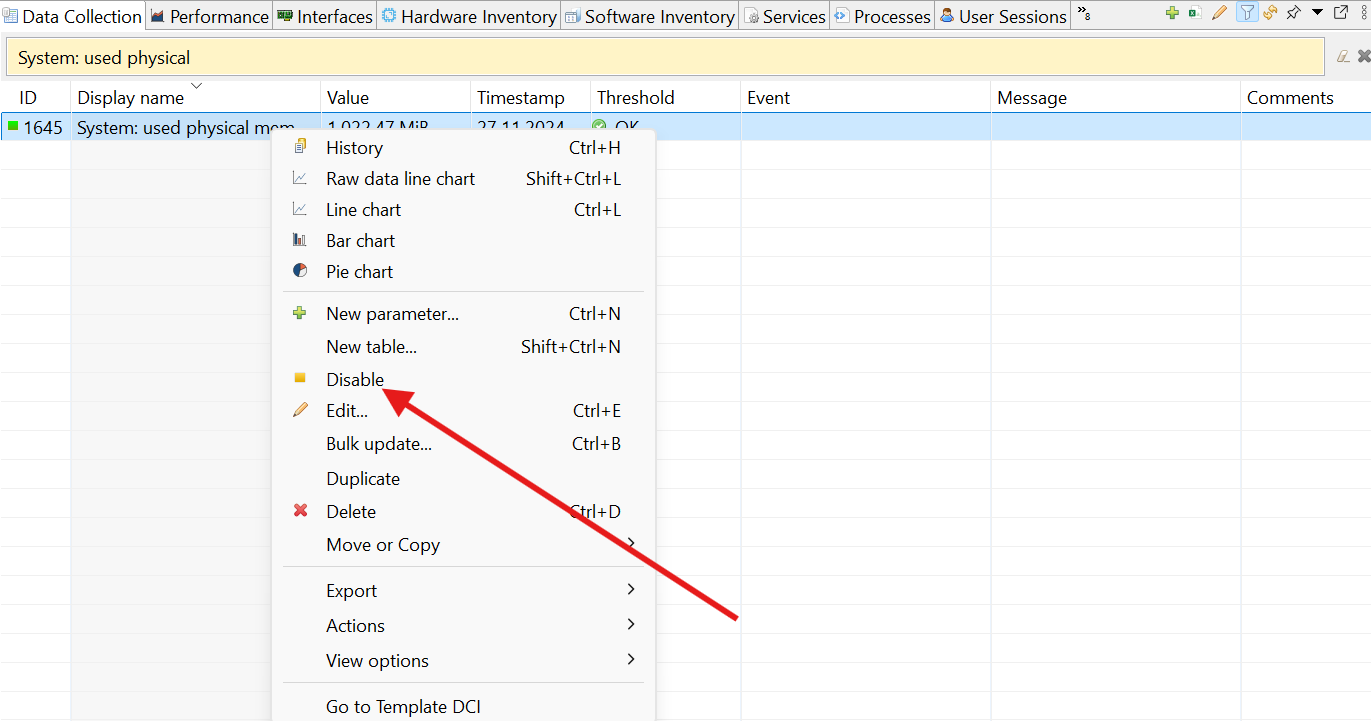
Status
DCI status can be one of the following: Active, Disabled, Not Supported. Server will collect data only if the status is Active. If you wish to stop data collection without removing DCI configuration and collected data, the Disabled status can be set manually. If requested metric is not supported by target node, the Not Supported status is set by the server.
Templates
What is template
Often you have a situation when you need to collect same metrics from different nodes. Such configuration making may easily fall into repeating one action many times. Things may became even worse when you need to change something in already configured DCIs on all nodes - for example, increase threshold for CPU utilization. To avoid these problems, one can use data collection templates. Data collection template (or just template for short) is a special object, which can have DCIs configured and grouped for similar or logical purposes and applied to relevant node or node group ( for example, Collector or Cluster in Infrastructure perspective). Templates can be accessed from Template perspective.
When you create template and configure DCIs for it, nothing happens - no data collection will occur. Then, you can apply this template to one or multiple nodes - and as soon as you do this, all DCIs configured in the template object will appear in the target node objects, and server will start data collection for these DCIs. If you then change something in the template data collection settings - add new DCI, change DCI’s configuration, or remove DCI - all changes will be reflected immediately in all nodes associated with the template. You can also choose to remove template from a node. In this case, you will have two options to deal with DCIs configured on the node through the template - remove all such DCIs or leave them, but remove relation to the template. If you delete template object itself, all DCIs created on nodes from this template will be deleted as well.
Please note that you can apply unlimited number of templates to a node - so you can create individual templates for each group of metrics (for example, generic performance metrics, MySQL metrics, network counters, etc.) and combine them, as per your business requirements.
Creating template
To create a template, right-click on Template Root or Template group object in Template perspective, and click . Enter a name for a new template and click OK.
Configuring templates
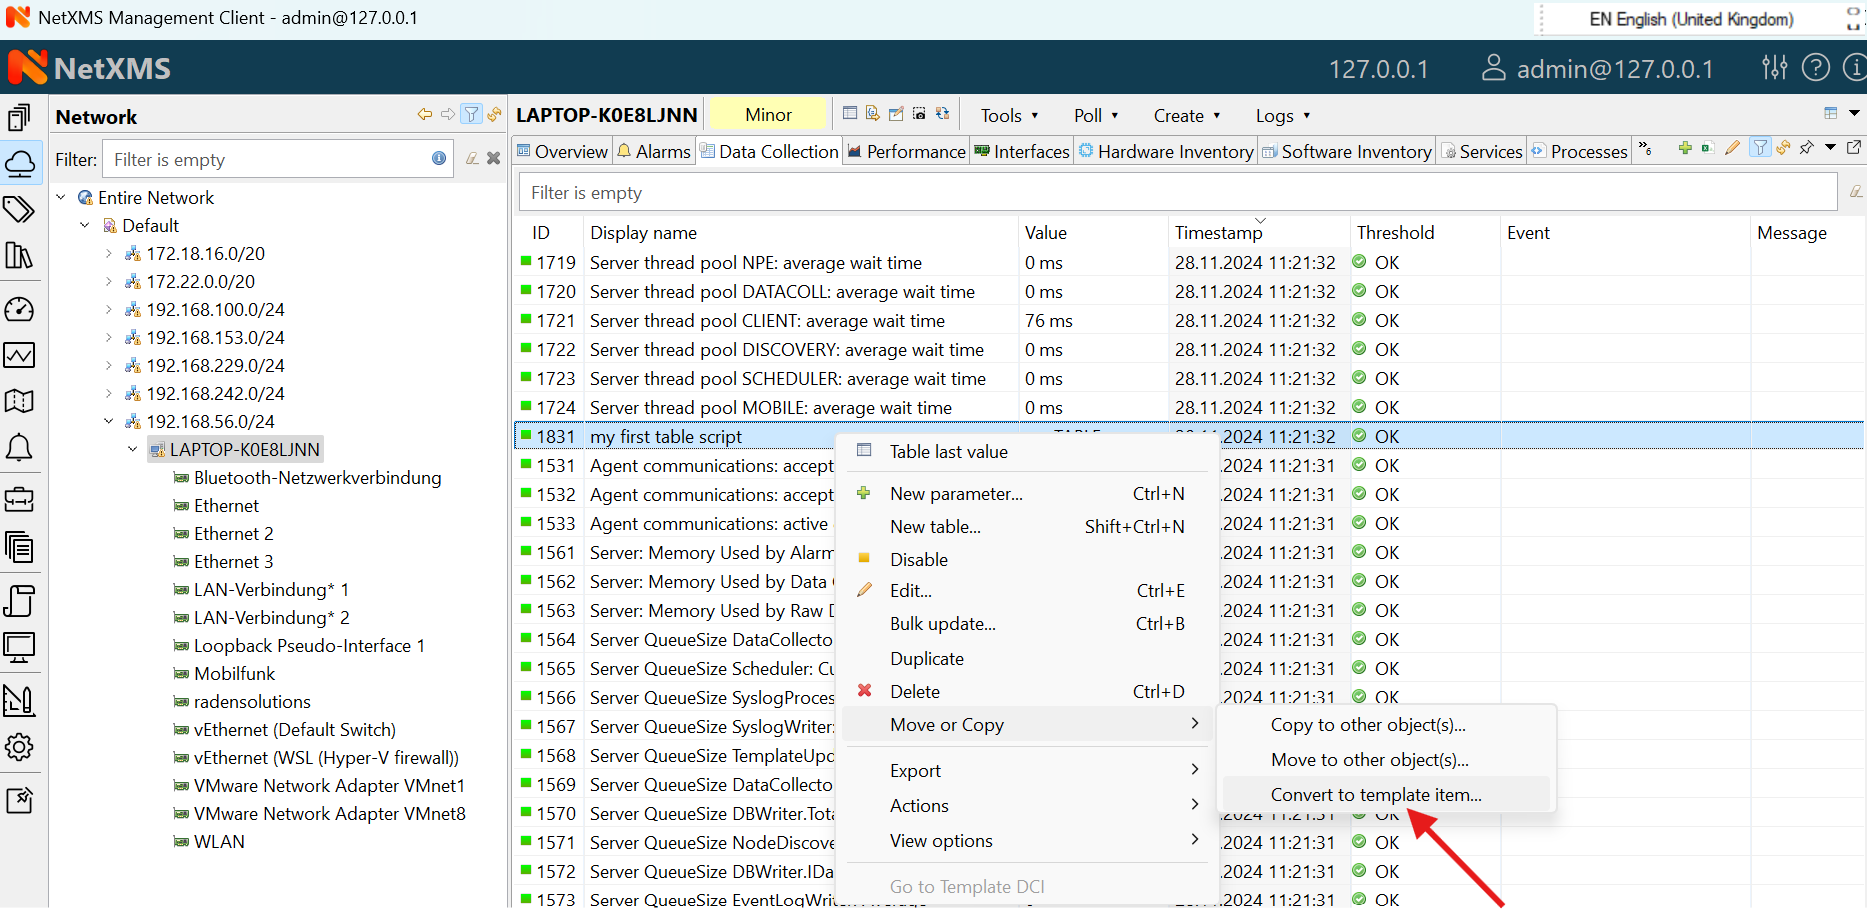
To configure DCIs in the template, click on Template object in the Template perspective, then right-click in Data Collection tab view and select New parameter… or New table… for further data collection configuration. You can configure DCIs in the same way as the node objects. Another way to apply configuration in Template - create DCI in Infrastructure or Network perspective and convert it to template item, as seen below.
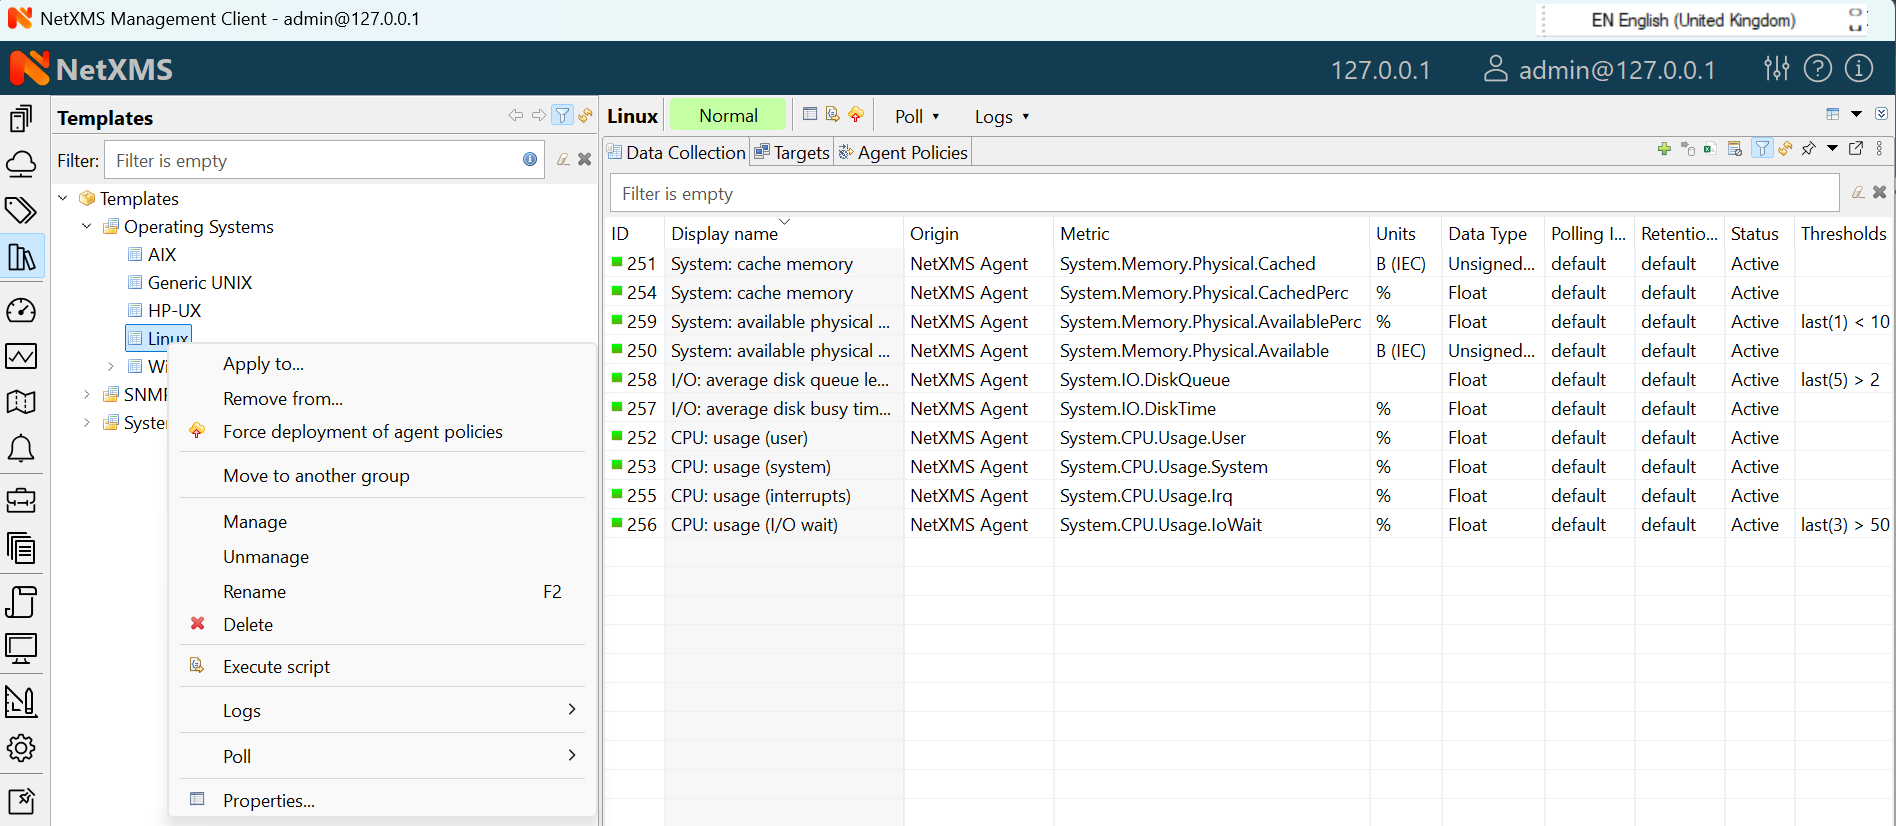
Applying template to node
To apply a template to one or more nodes, right-click on template object in Template perspective and select Apply to…. Pop-up menu will appear with objects in Infrastructure and Network perspectives available for selection. Select objects that you wish to apply template to, and click OK (you can select multiple nodes in the list by holding Control key). Please note that if data collection editor is open for any of the target nodes, either by you or another administrator, template applying will be delayed until data collection editor for that node will be closed. Another way to apply template to object - in Infrastructure or Network perspectives select one or more objects, right-click and select Apply template…
Removing template from node
To remove a link between template and node, right-click on Template object in Template perspective and select Remove from…. Pop-up menu will appear with objects, which are having the template in question already applied. Select objects that you wish to remove template from, and click OK.
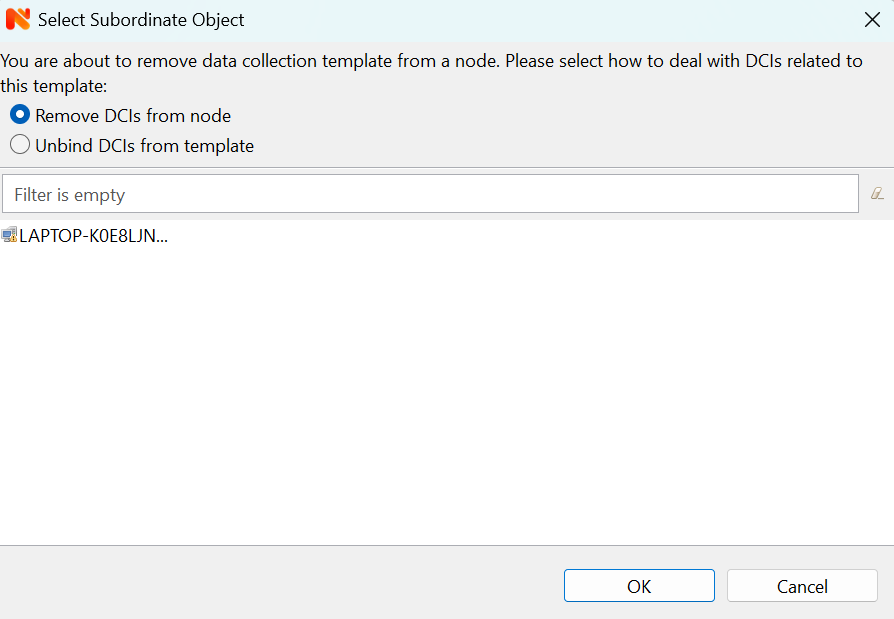
Another way to remove template from object - in Infrastructure or Network perspective select one or more objects, right-click and select Remove template…. Pop-up window will appear with all applied templates to objects. Select templates to be removed and click OK.
If you select Unbind DCIs from template, all DCIs related to template will remain configured on a node, but association between the DCIs and template will be removed. Any further changes to the template will not be reflected in these DCIs. If you later reapply the template to the node, you will have two copies of each DCI - one standalone (remaining from unbind operation) and one related to template (from new apply operation). Selecting Remove DCIs from node will remove all DCIs associated with the template. After you click OK, node will be unbound from template.
Macros in template items
You can use various macros in name, description, and instance fields of
template DCI. These macros will be expanded when template applies to node.
Macro started with %{ character combination and ends with } character.
The following macros are currently available:
Macro |
Expands to |
|---|---|
node_id |
Node unique id |
node_name |
Node name |
node_primary_ip |
Node primary IP address |
script:name |
String returned by script name. Script should be stored in script library (accessible via ). Inside the script, you can access current node’s properties via $node variable. |
For example, if you wish to insert node’s IP address into DCI description, you can enter the following in the description field of template DCI:
My IP address is %{node_primary_ip}
When applying to node with primary IP address 10.0.0.1, on the node will be created DCI with the following description:
My IP address is 10.0.0.1
Please note that if you change something in the node, name for example, changes will not be reflected automatically in DCI texts generated from these macros. However, they will be updated if you reapply template to the node or on housekeeper run.
Working with collected data
Once you setup DCI, data starts collecting in the database. You can access this data and work with it in different ways. Data can be visualized in three ways: in graphical form, as a historical view(textual format) and as DCI summary table, this layout types can be combined in Dashboards. More detailed description about visualization and layout can be found there: Data and Network visualisation.
Comments
This configuration page can be used freely for text comments to add additional notes about DCI configuration or usage. These comments are added to alarms created from threshold violation events. For example, they can be used to inform operators about problem-solving approaches.